
This study examines relationships between digital technology adoption, innovation, and firm performance using data from 1,028 Vietnamese enterprises surveyed in 2023. We extracted and analyzed data from the World Bank Enterprise Survey global dataset, creating 23 enterprise segments across firm sizes, sectors, regions, and characteristics.
Using correlation analysis with statistical significance testing, we identify which digital tools link most strongly to performance outcomes. Results reveal three key findings. First, electronic payment systems have the strongest link to performance. Both sales and purchase payment digitalization correlate at 0.77 with productivity growth (p<0.001). Second, a clear digital gap exists across firm size. Website adoption reaches 66.3% among large firms but only 42.3% among small firms. Third, digitally advanced segments grow through productivity rather than employment expansion.
The findings offer clear policy direction. Electronic payment infrastructure deserves priority investment given its robust links to both productivity and revenue growth. Small firms need targeted support to overcome adoption barriers. Credit access correlates strongly with process innovation (r=0.65, p<0.001), suggesting financial support can accelerate capability building.
Keywords: digital adoption, firm innovation, innovation performance, technology adoption, Vietnamese enterprises.
Our codes and models are available at https://github.com/TrinhQuocNguyen/WBES_INCOTEH_2026.
Table 1. Dataset Structure
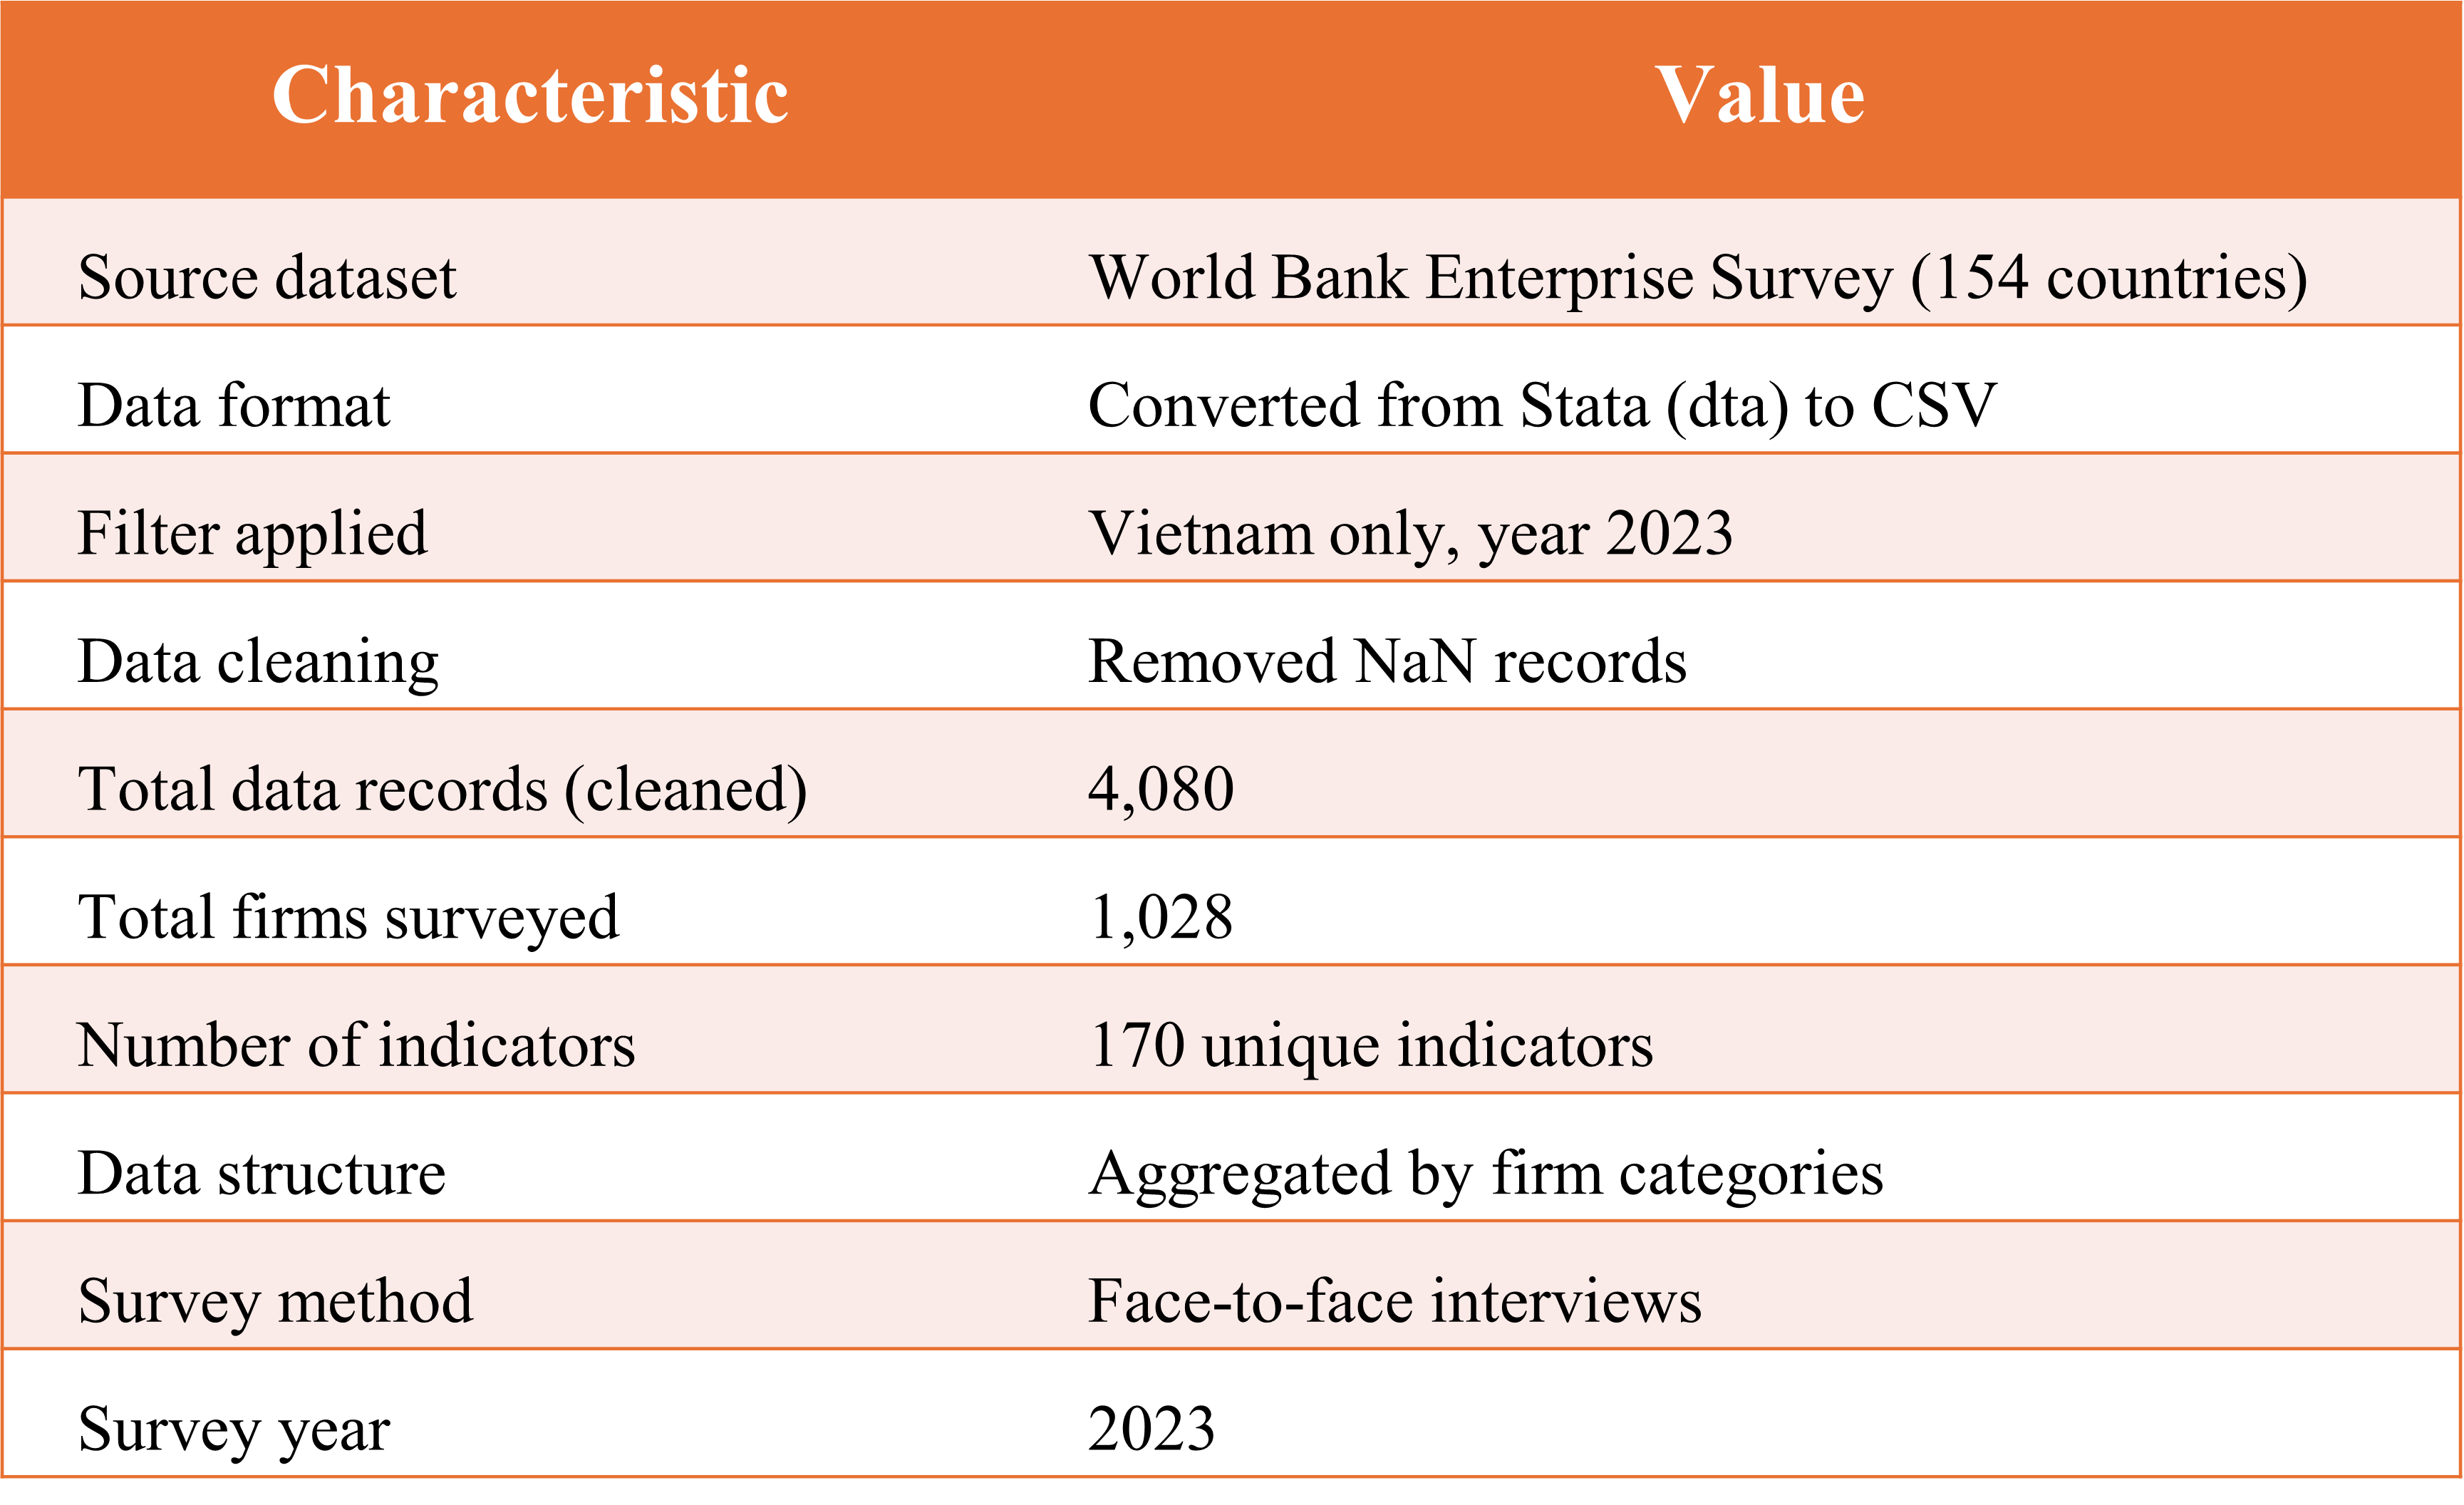
Source: World Bank Enterprise Survey 2023.
Figure 1. Distribution of Surveyed Firms by Size Category
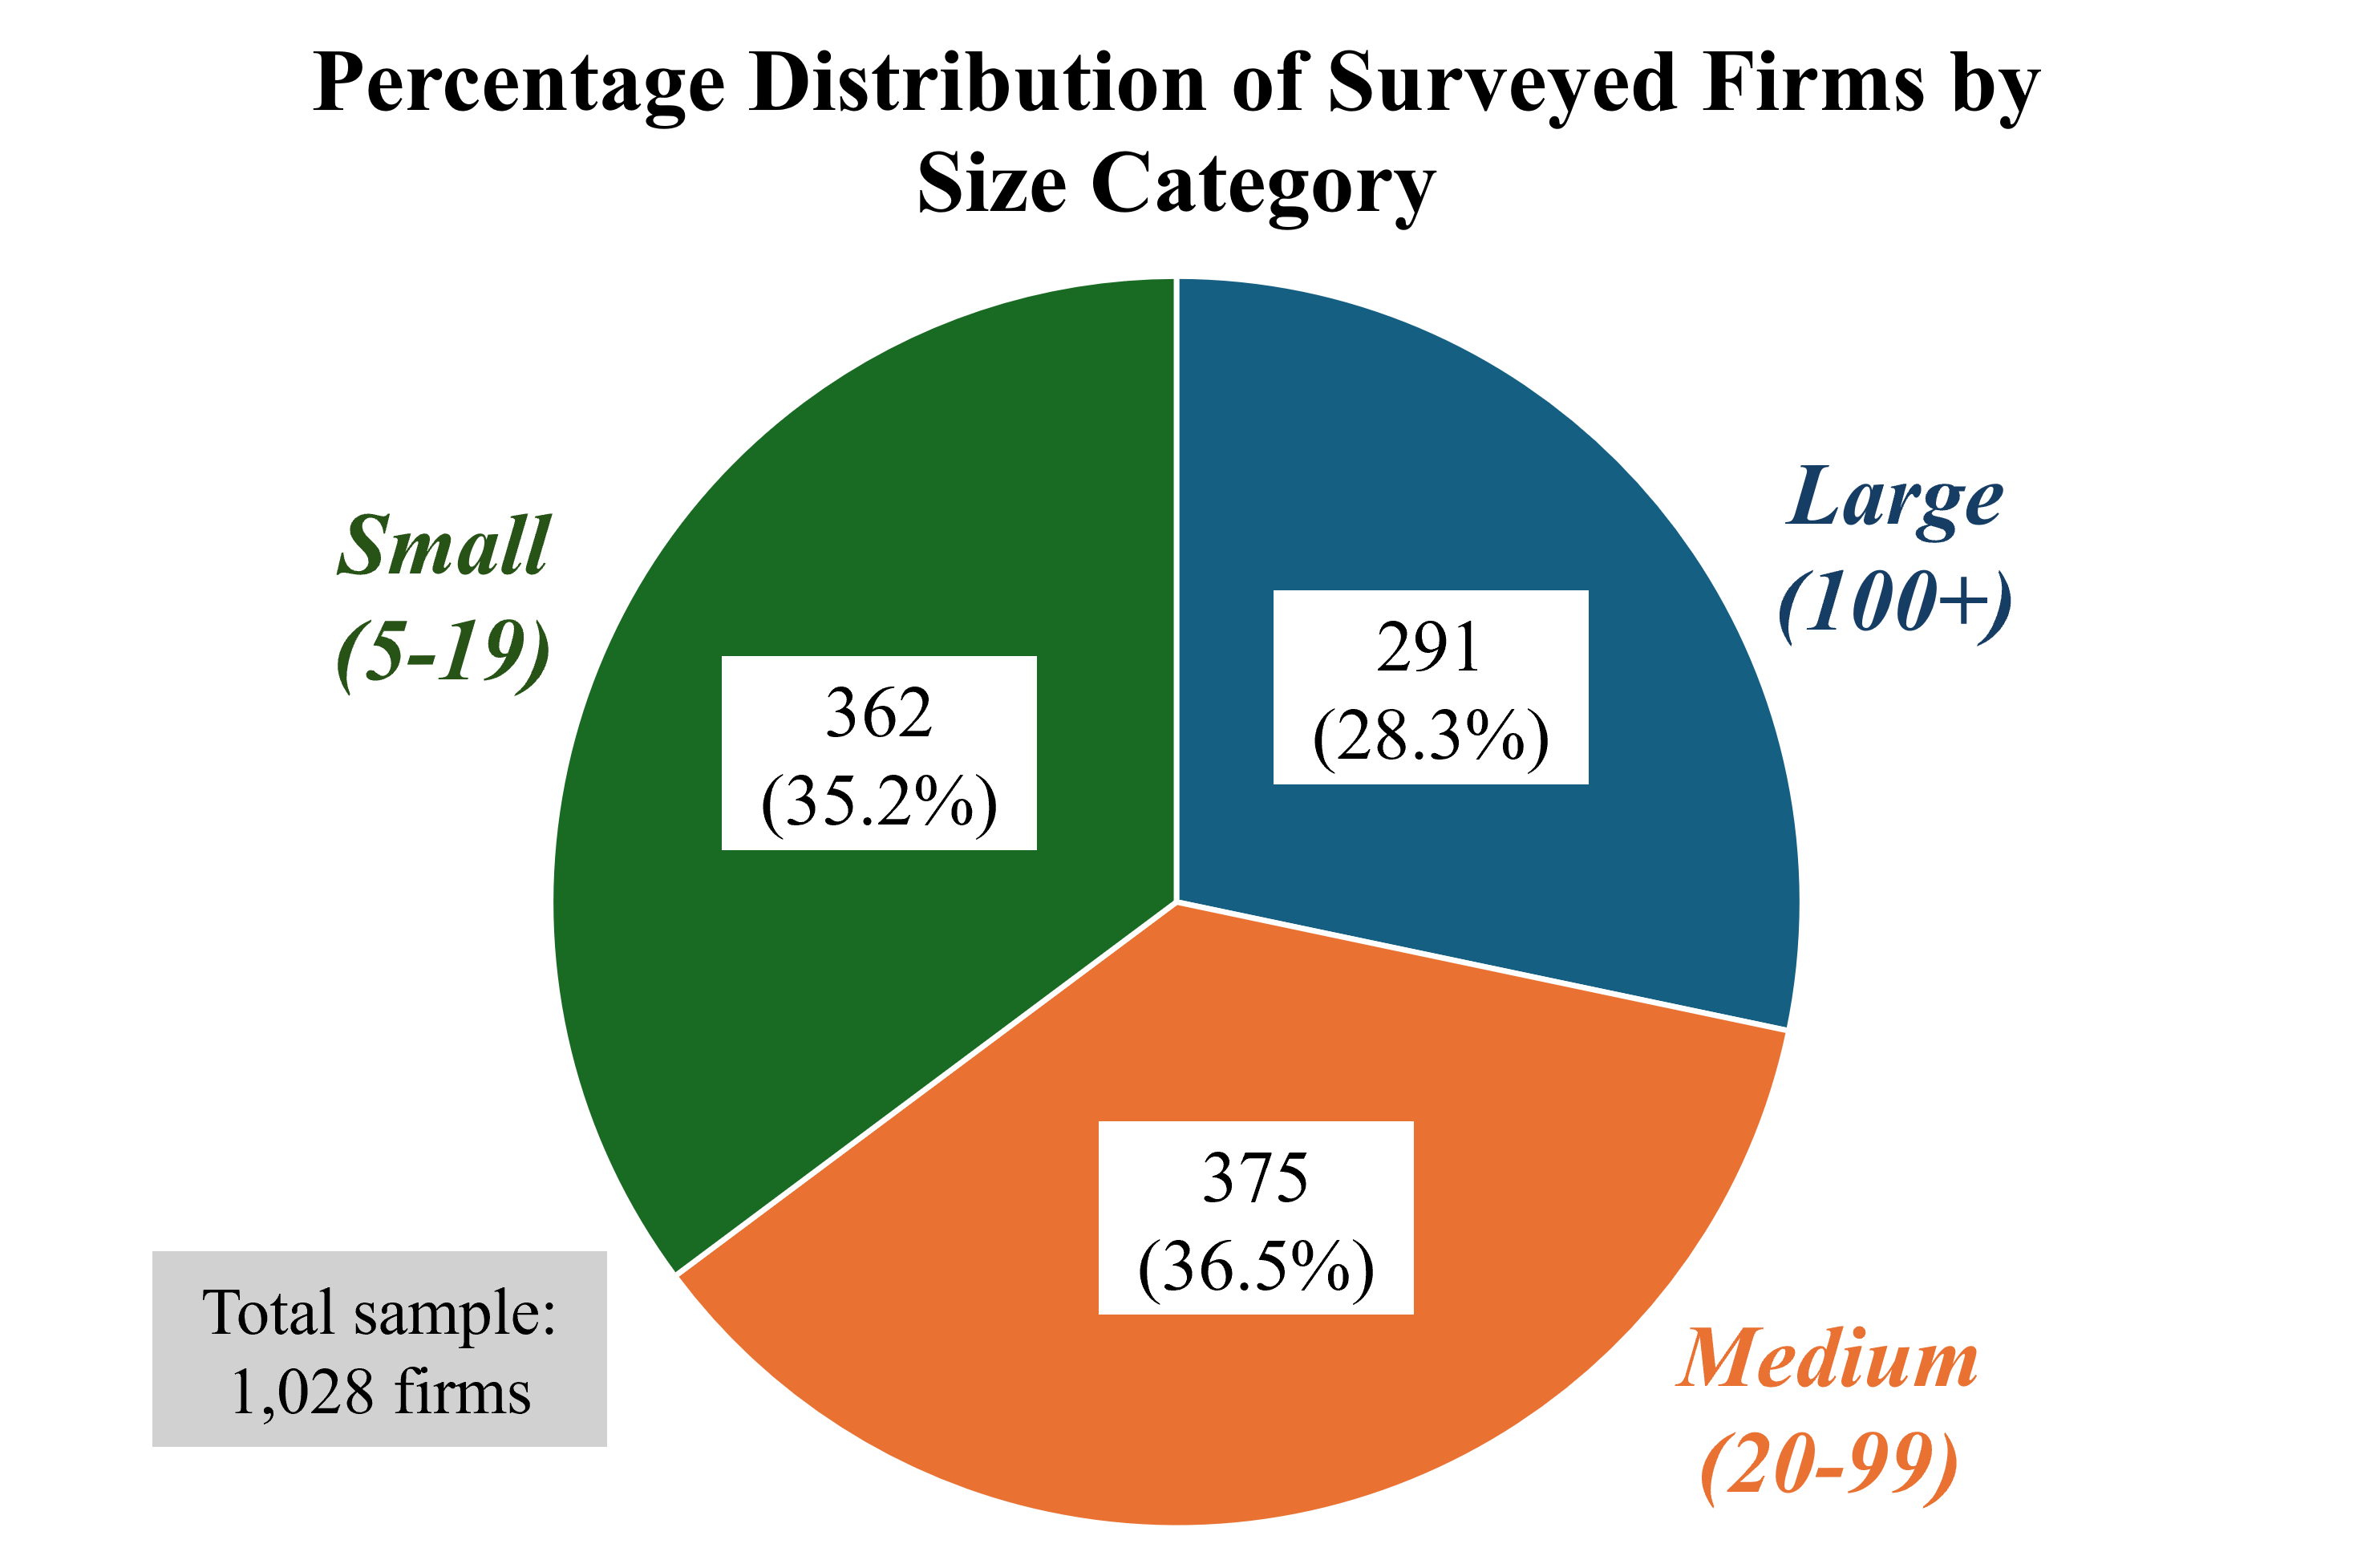
Authors' calculations from World Bank Enterprise Survey 2023
Figure 2. Analytical pipeline for data processing and analysis
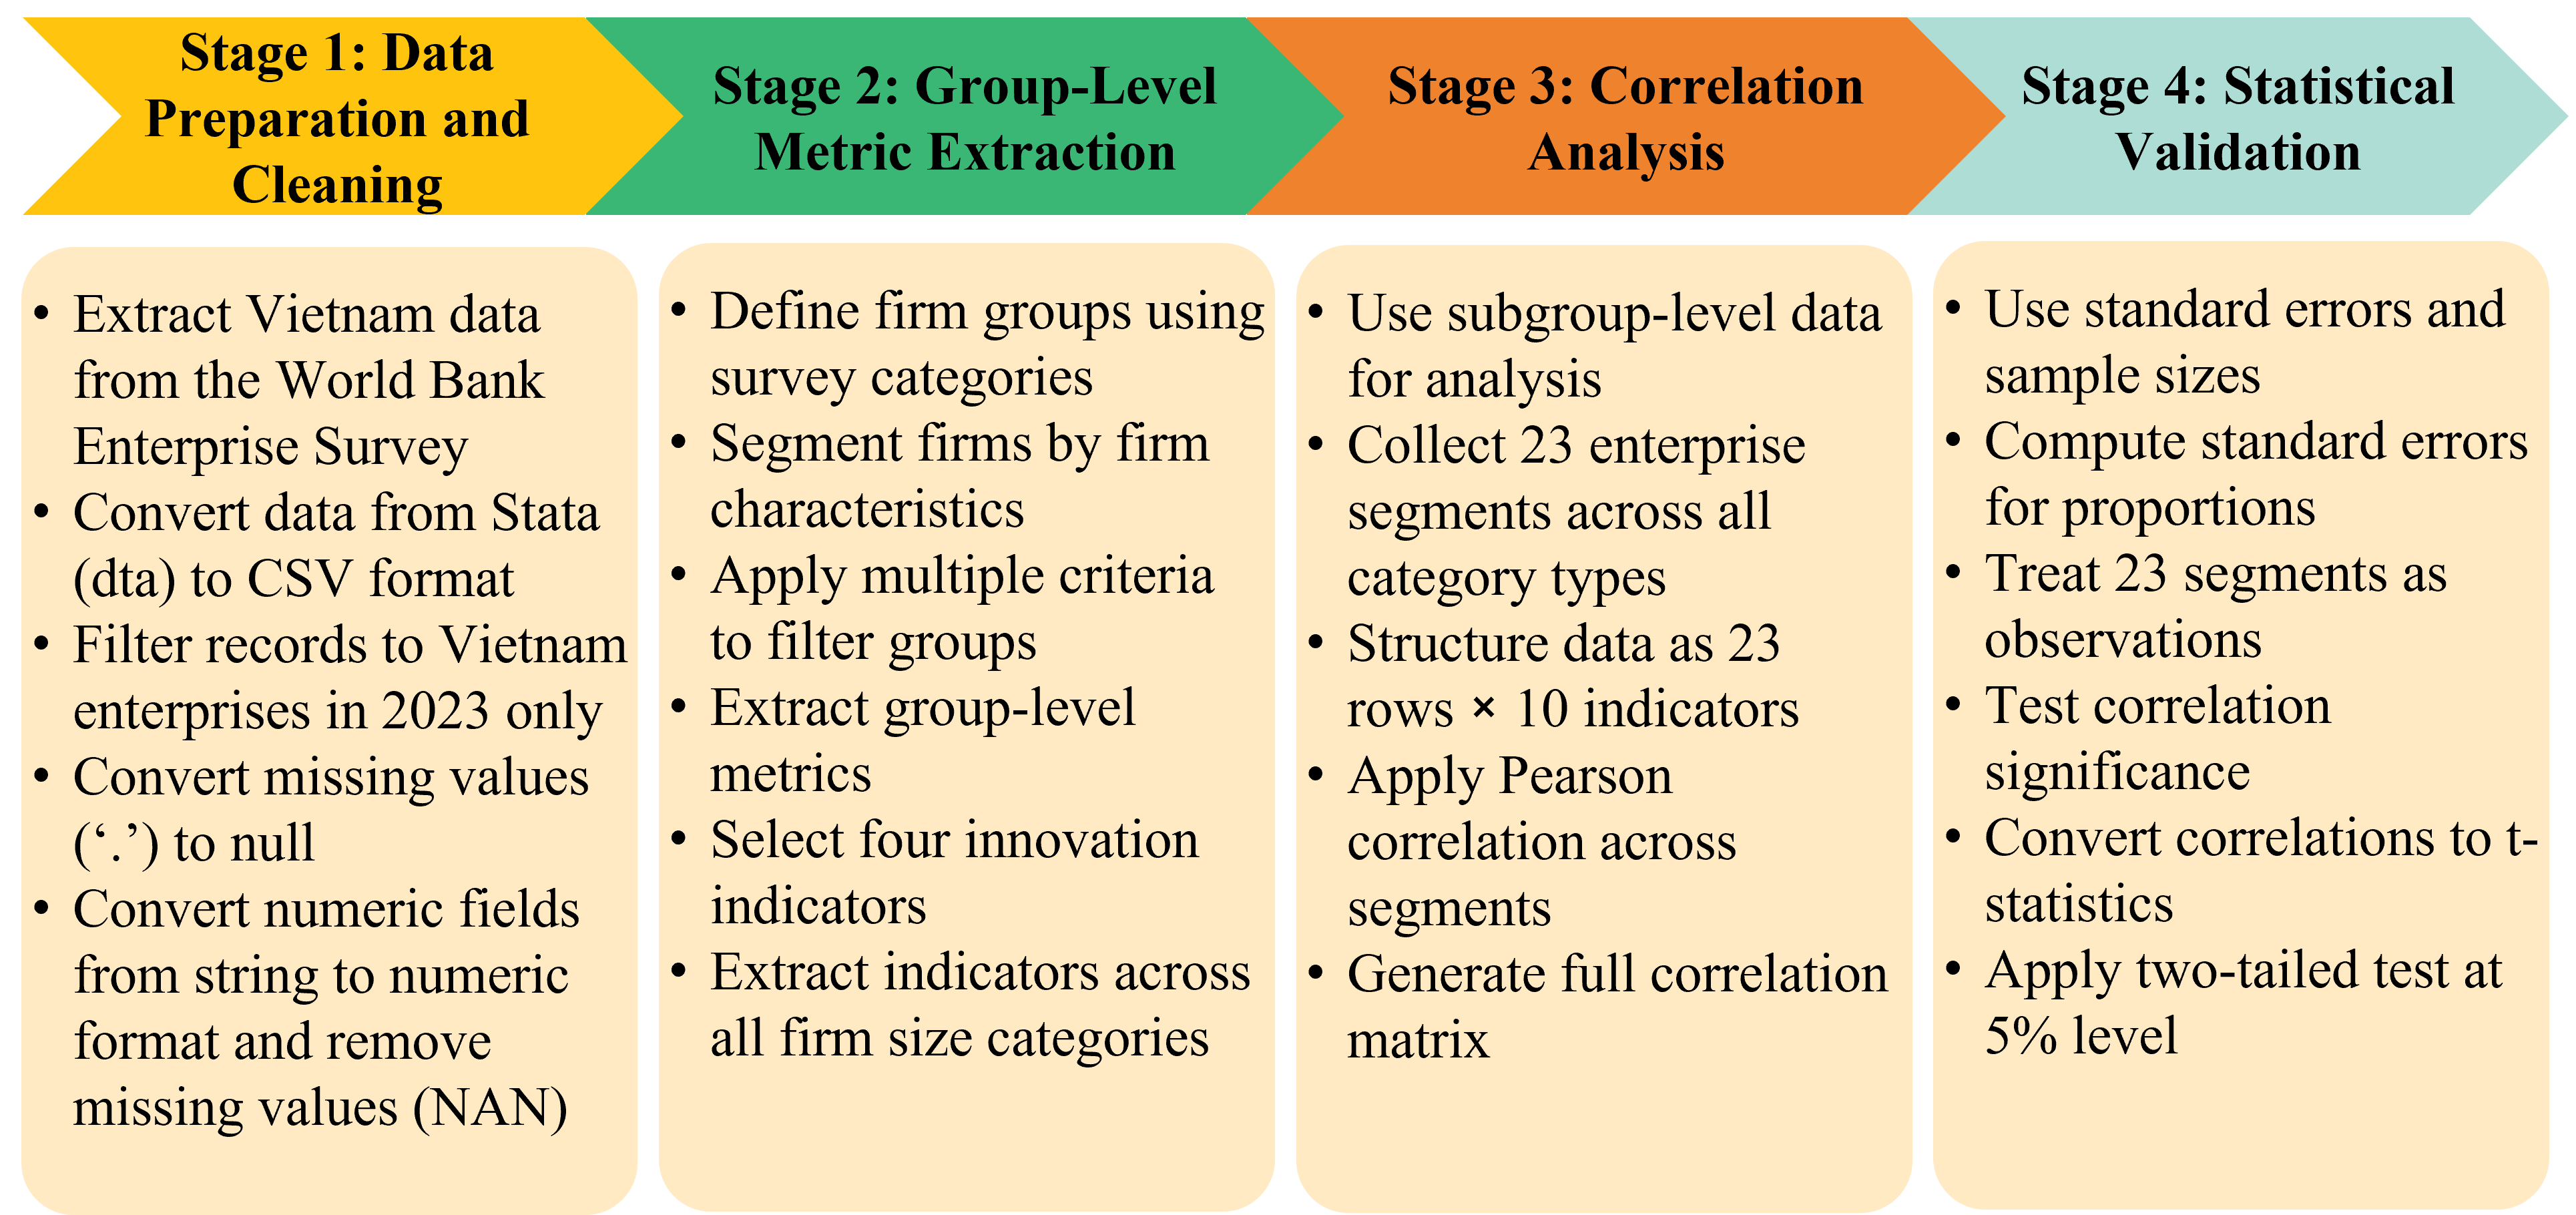
Source: Authors’ analysis based on World Bank Enterprise Survey data (2023), implemented in Python using pandas and NumPy.
Table 2. Innovation Metrics by Firm Size
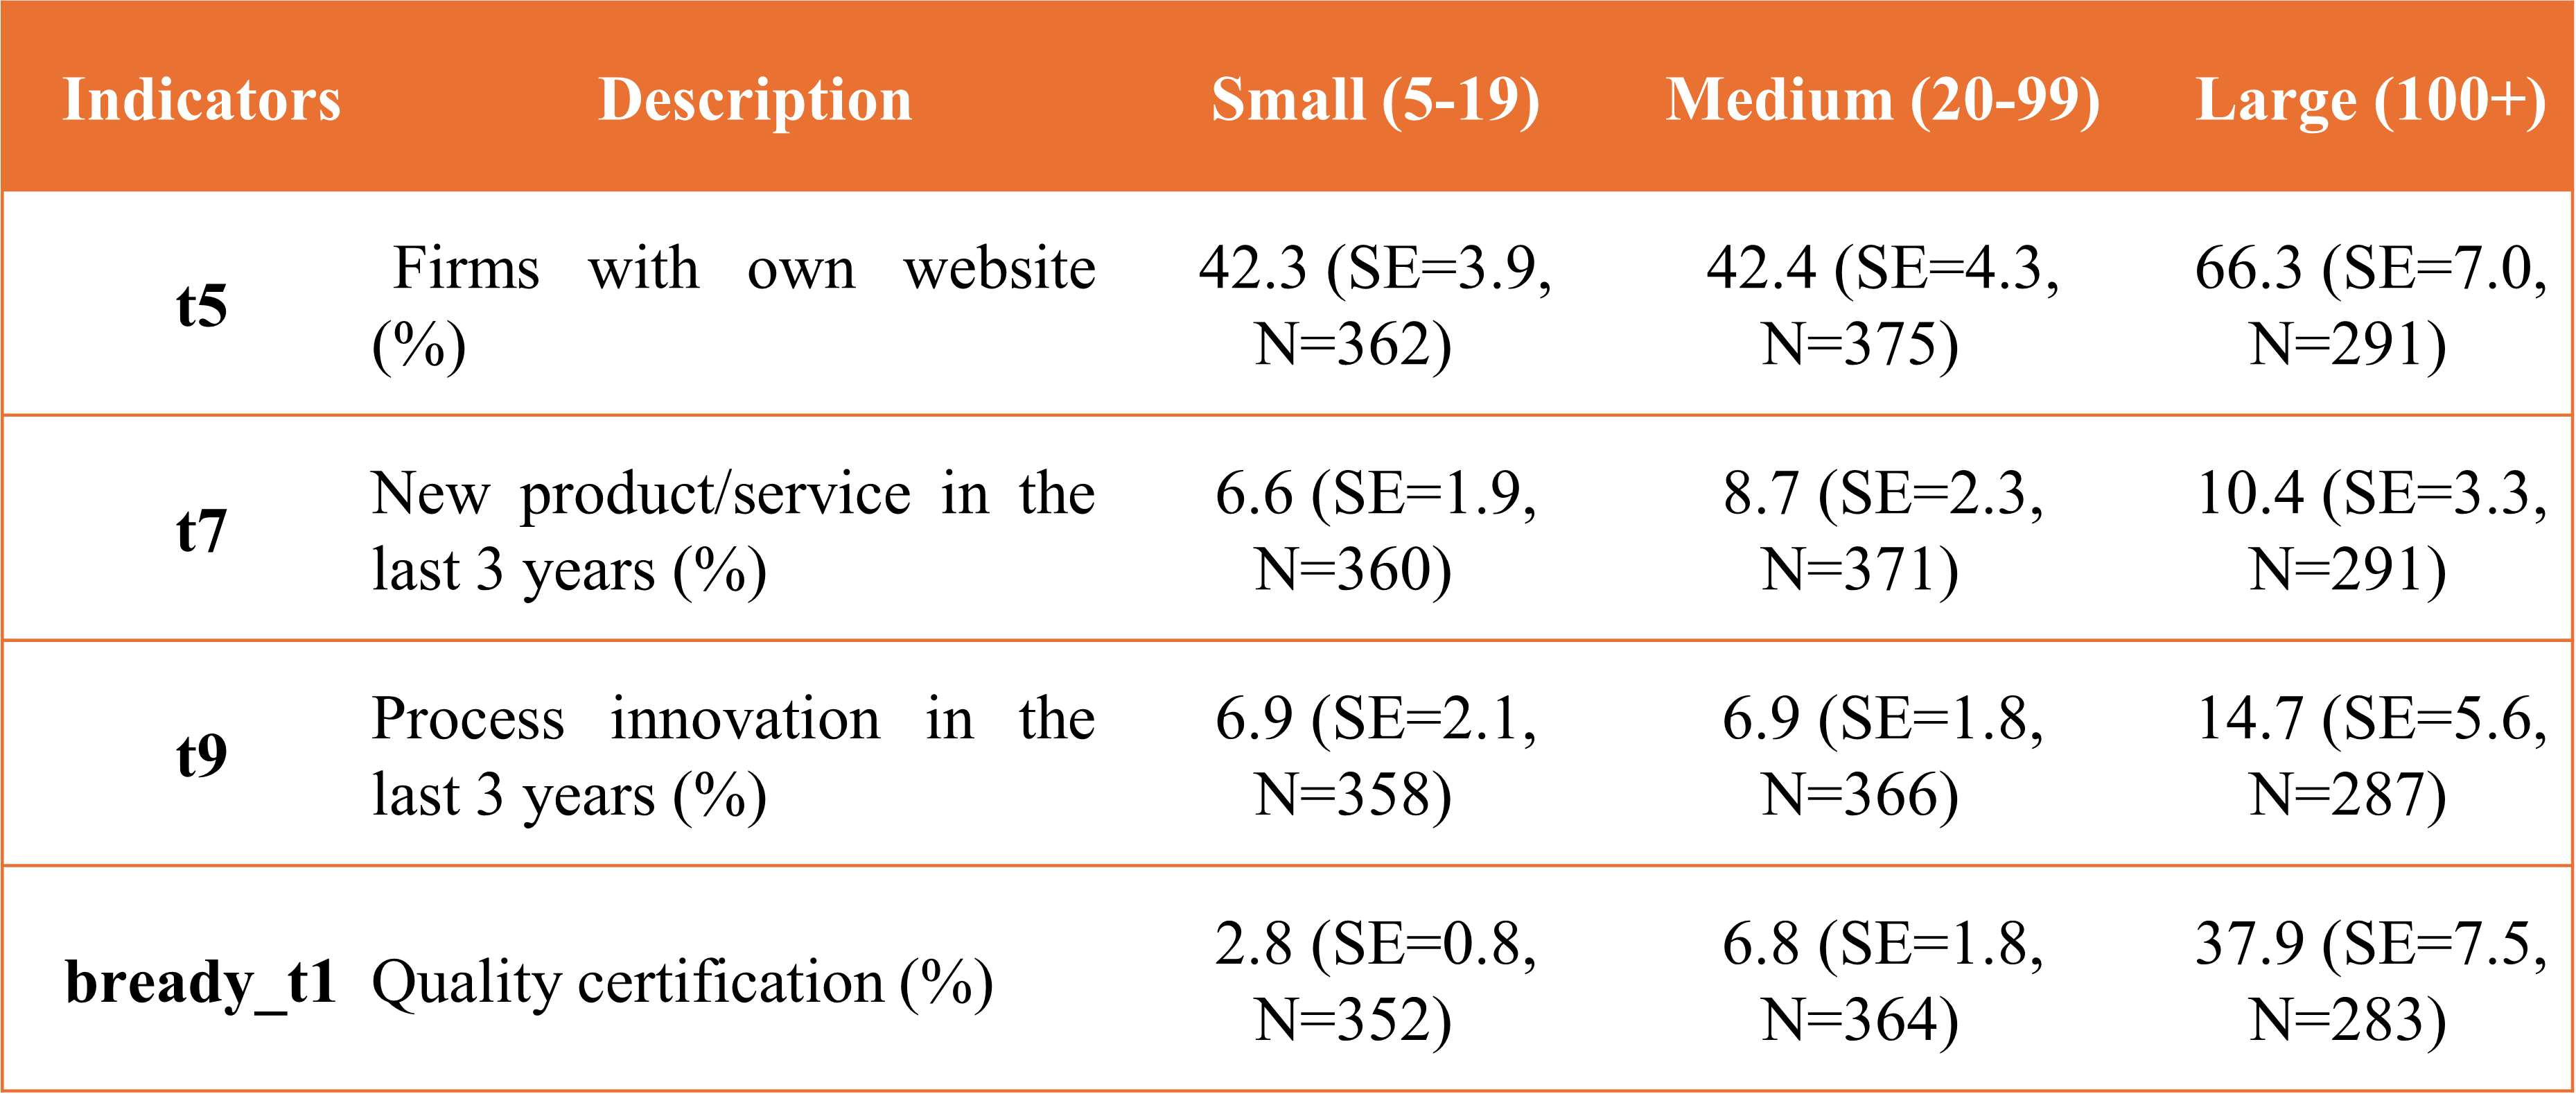
Source: Authors' calculations from World Bank Enterprise Survey 2023.
Note: Standard errors (SE) and sample sizes (N) reported for each estimate.
Table 3. Correlations Between Digital, Innovation, and Performance Indicators
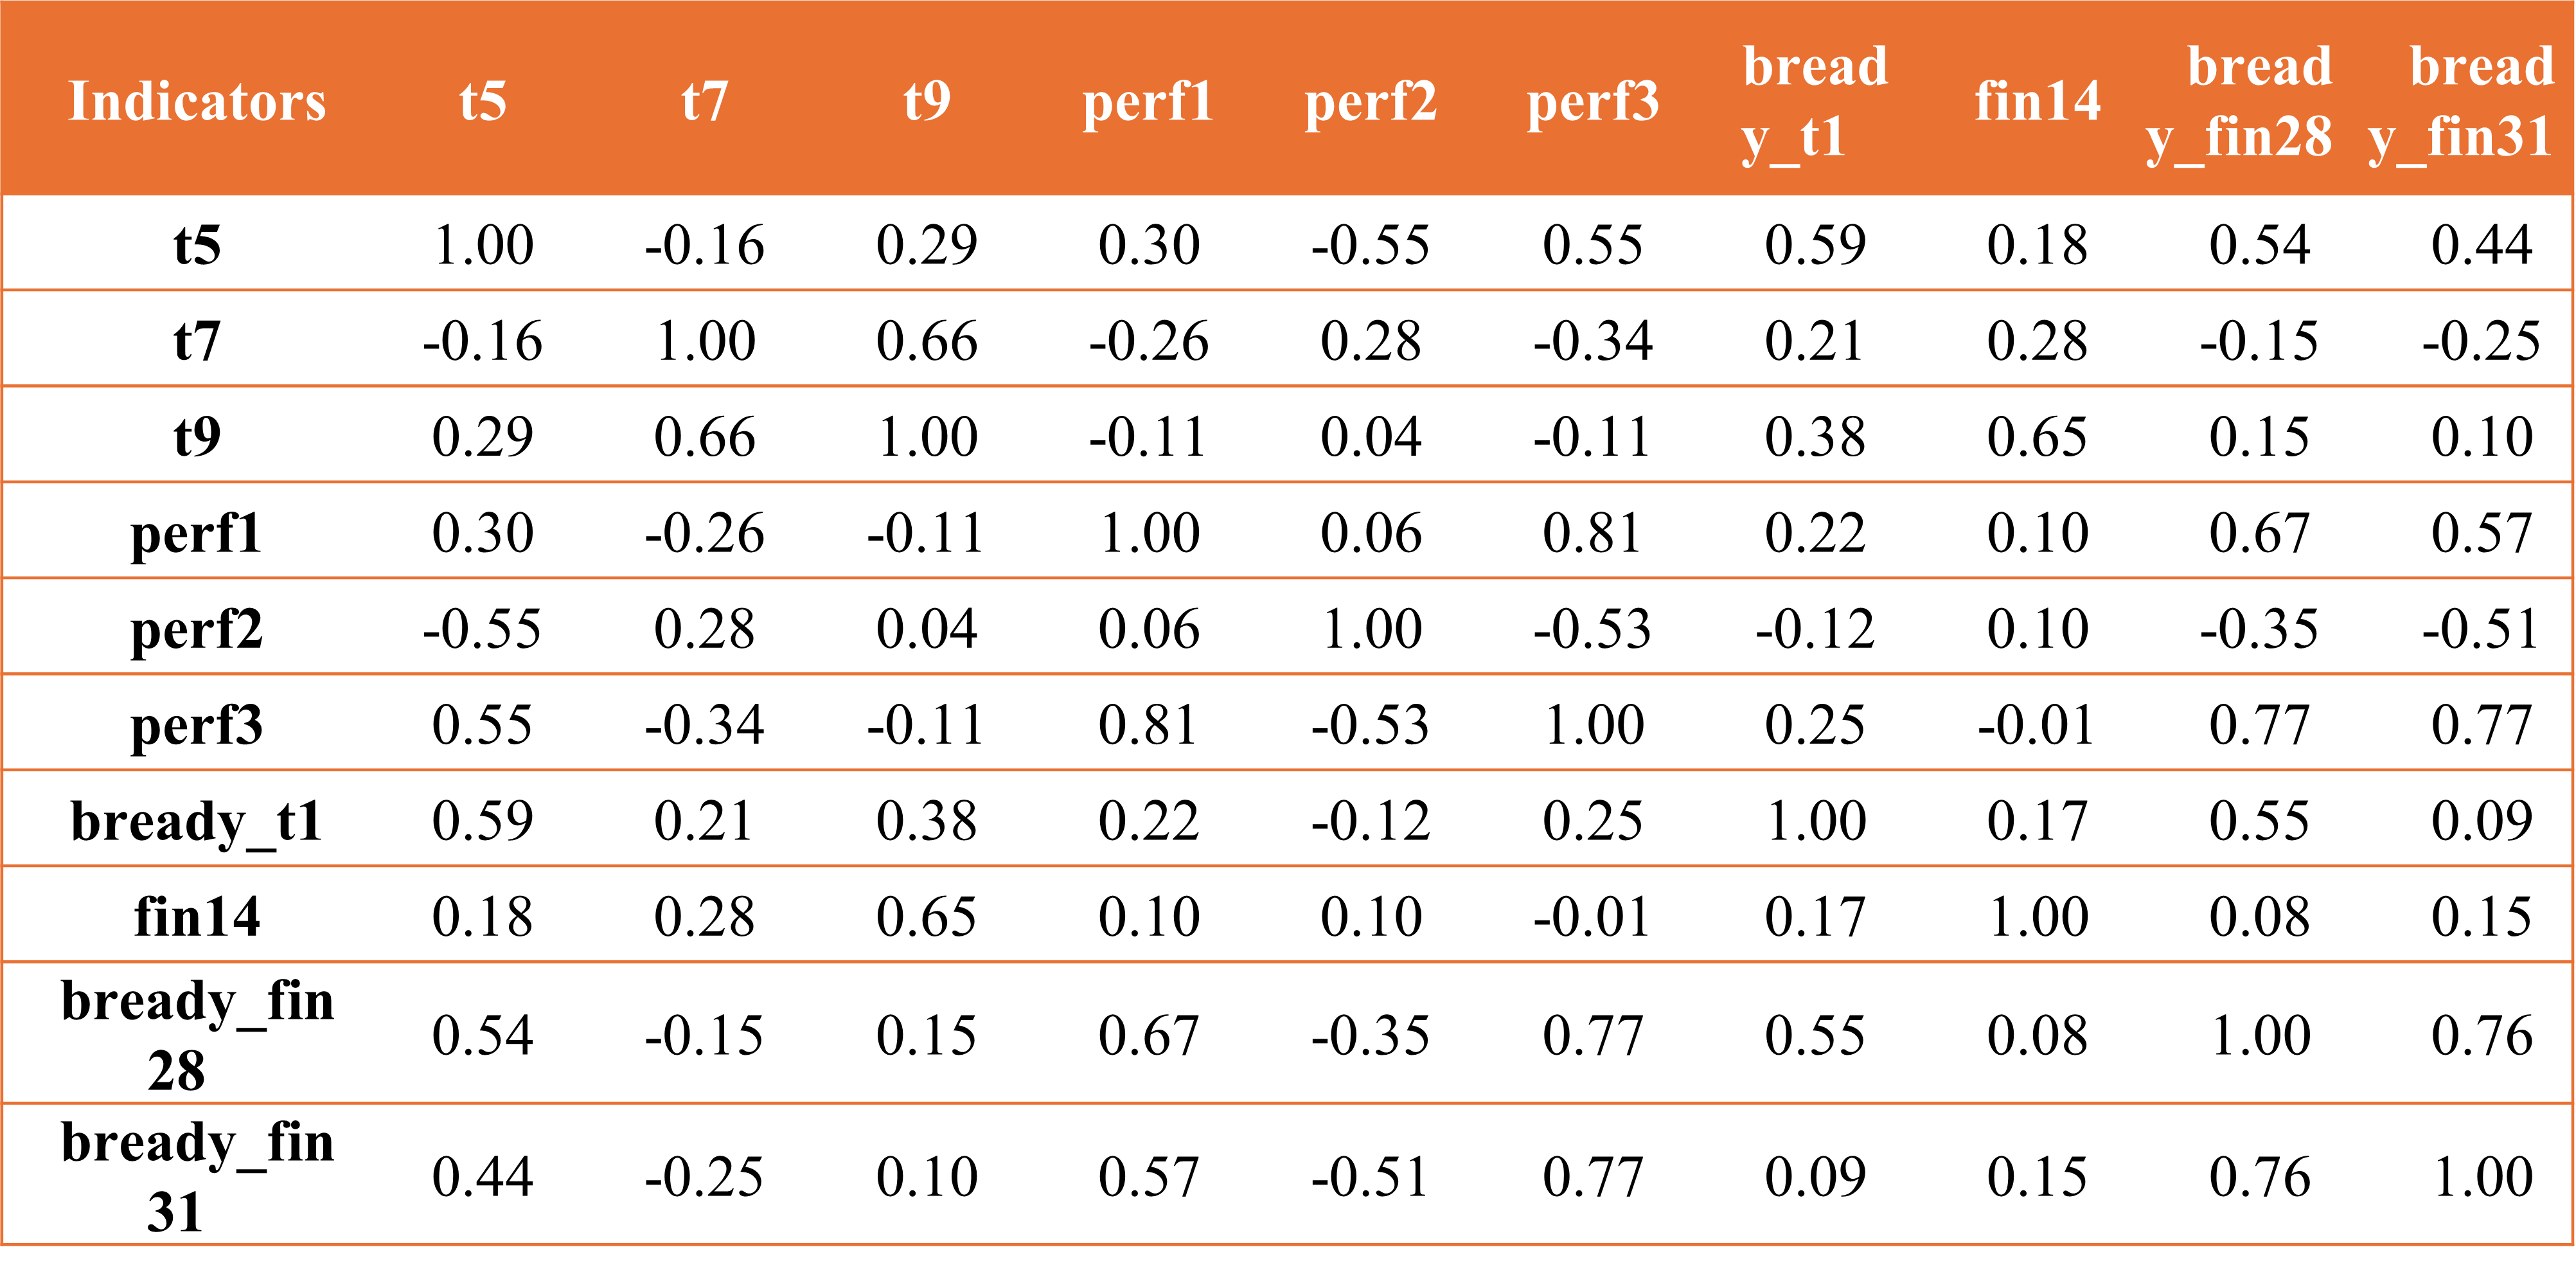
Source: Authors' calculations.
Note: t5 = website, t7 = new product, t9 = process innovation, perf1 = sales growth, perf2 = employment growth, perf3 = productivity growth, bready_t1 = quality certification, fin14 = bank loan/credit, bready_fin28 = electronic sales payments, bready_fin31 = electronic purchase payments. Correlations are computed across 23 enterprise segments.
Figure 3. Correlation Heatmap
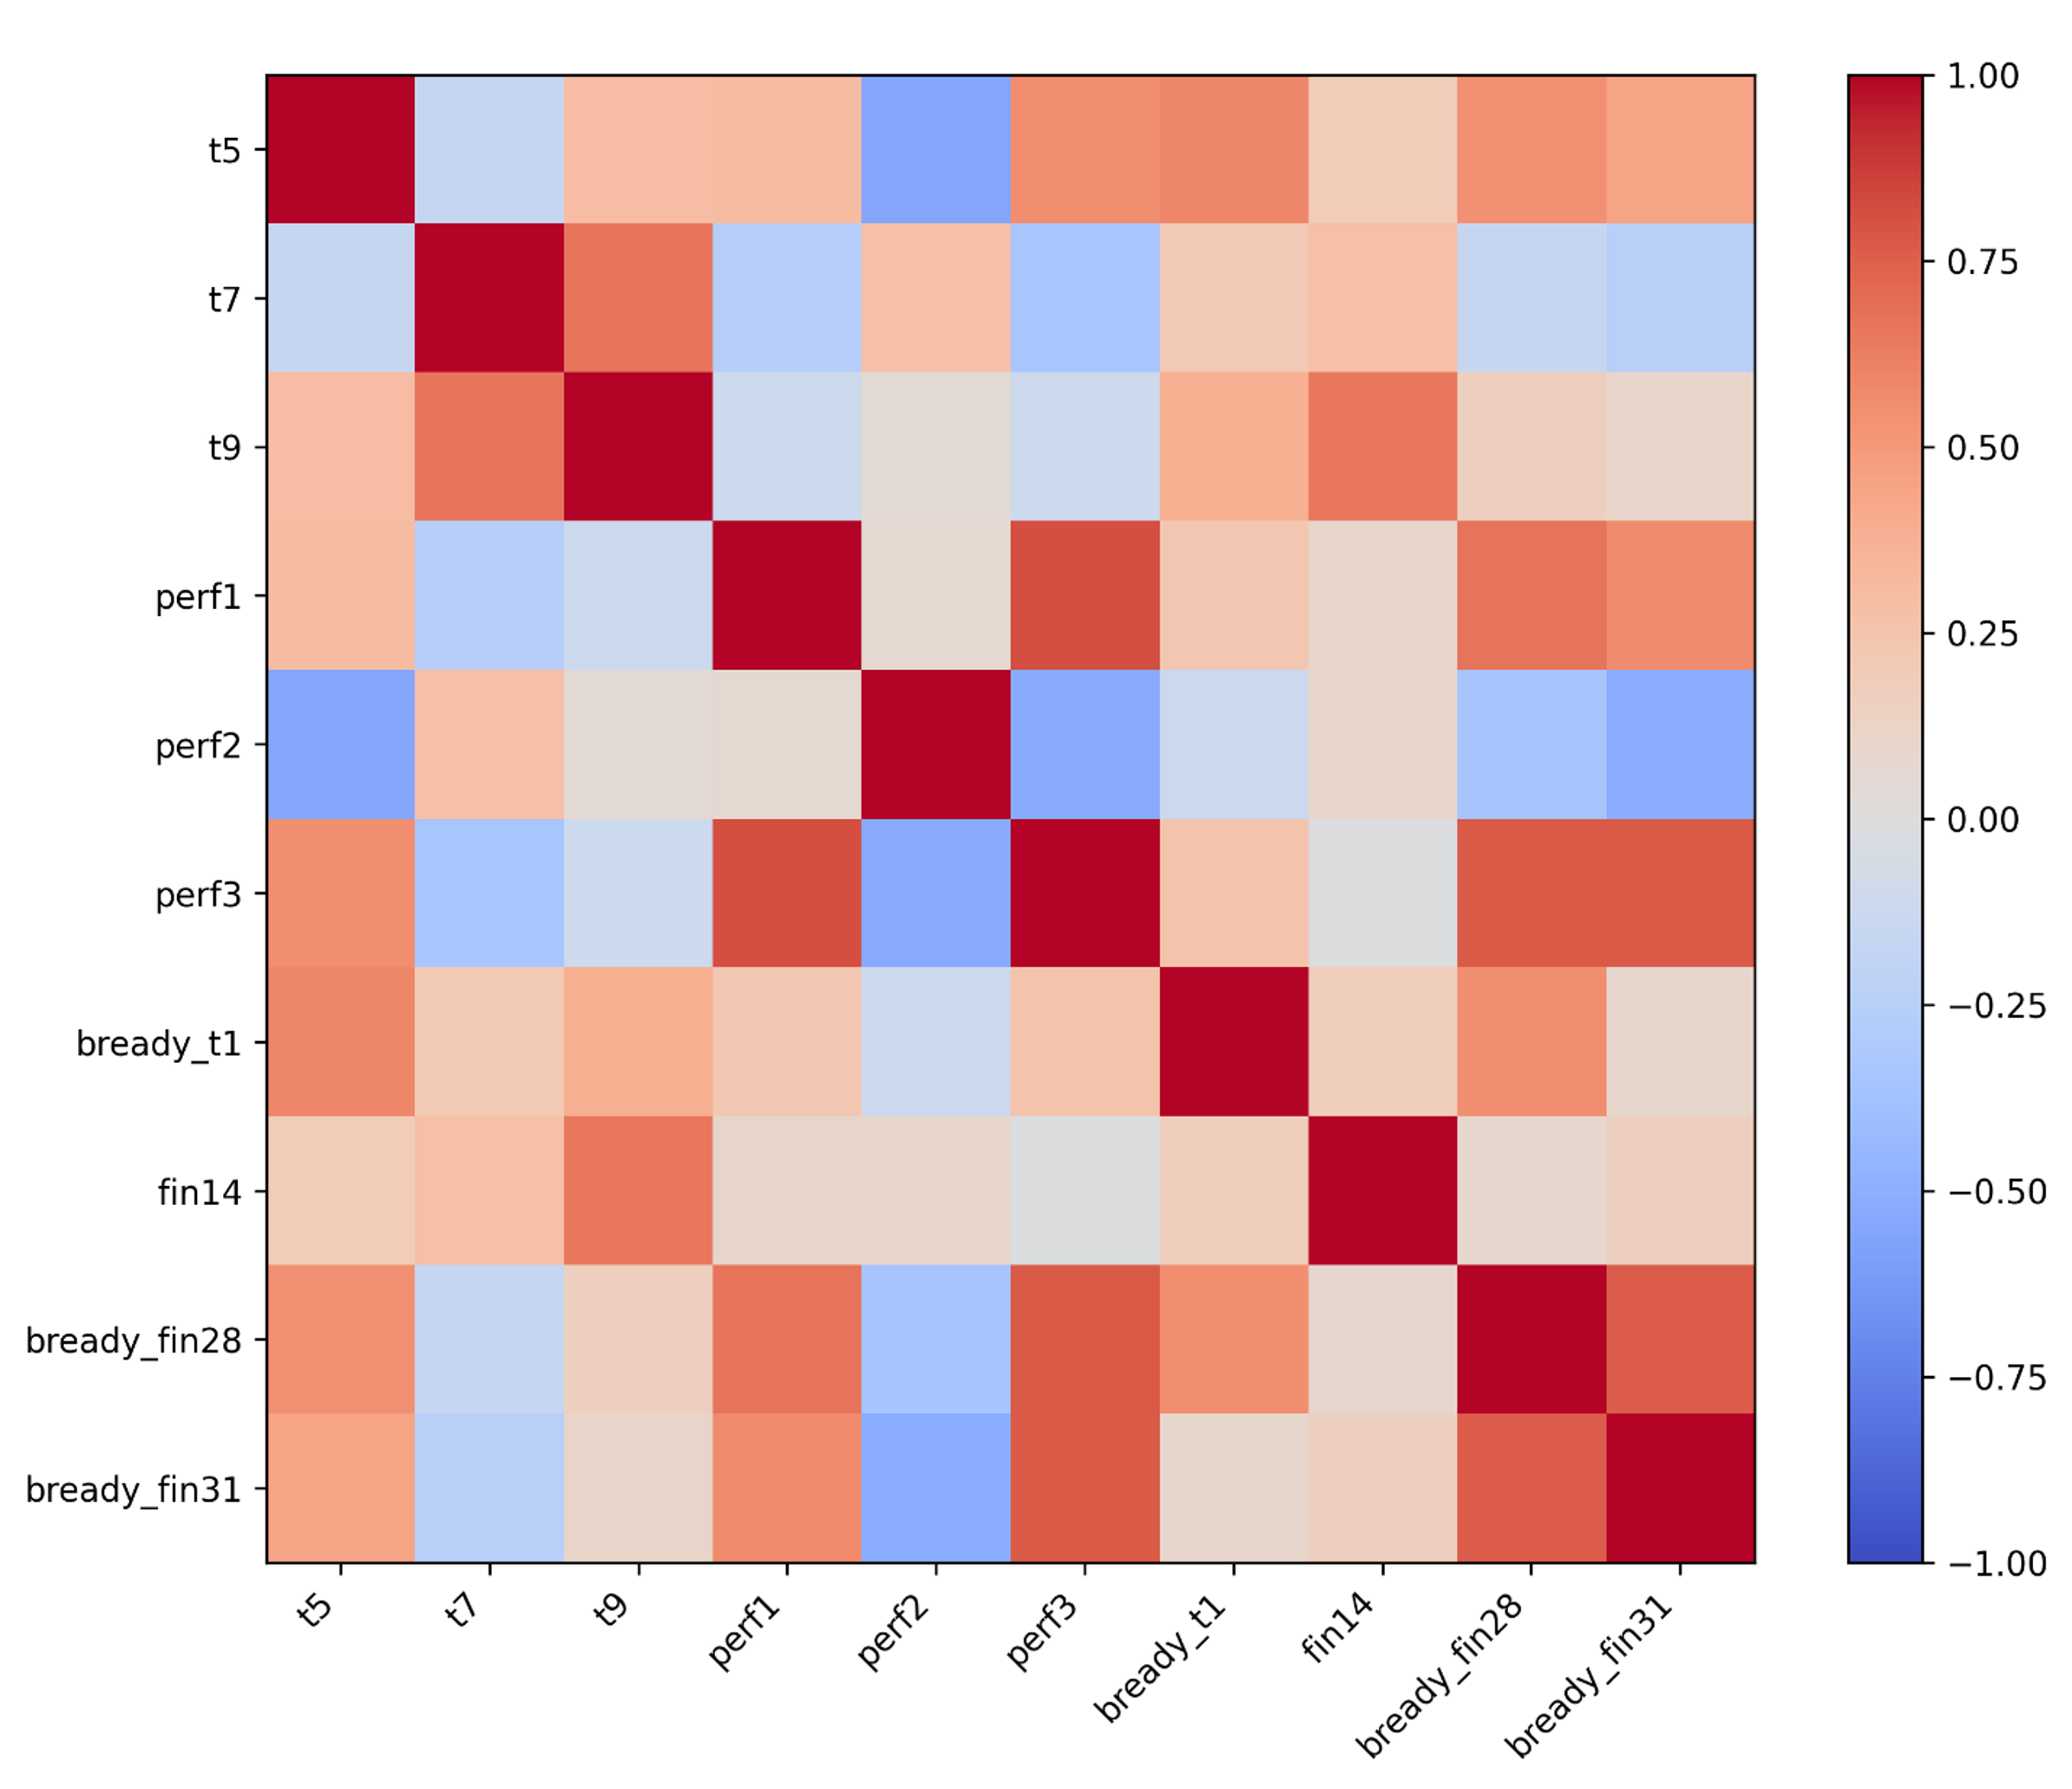
Source: Authors' calculations.
Note: Red (+1) signifies strong positive correlation, white (0) represents no relationship, and blue (-1) indicates strong negative correlation. Based on 23 enterprise segments.
Table 4. Statistical Significance of Key Correlations
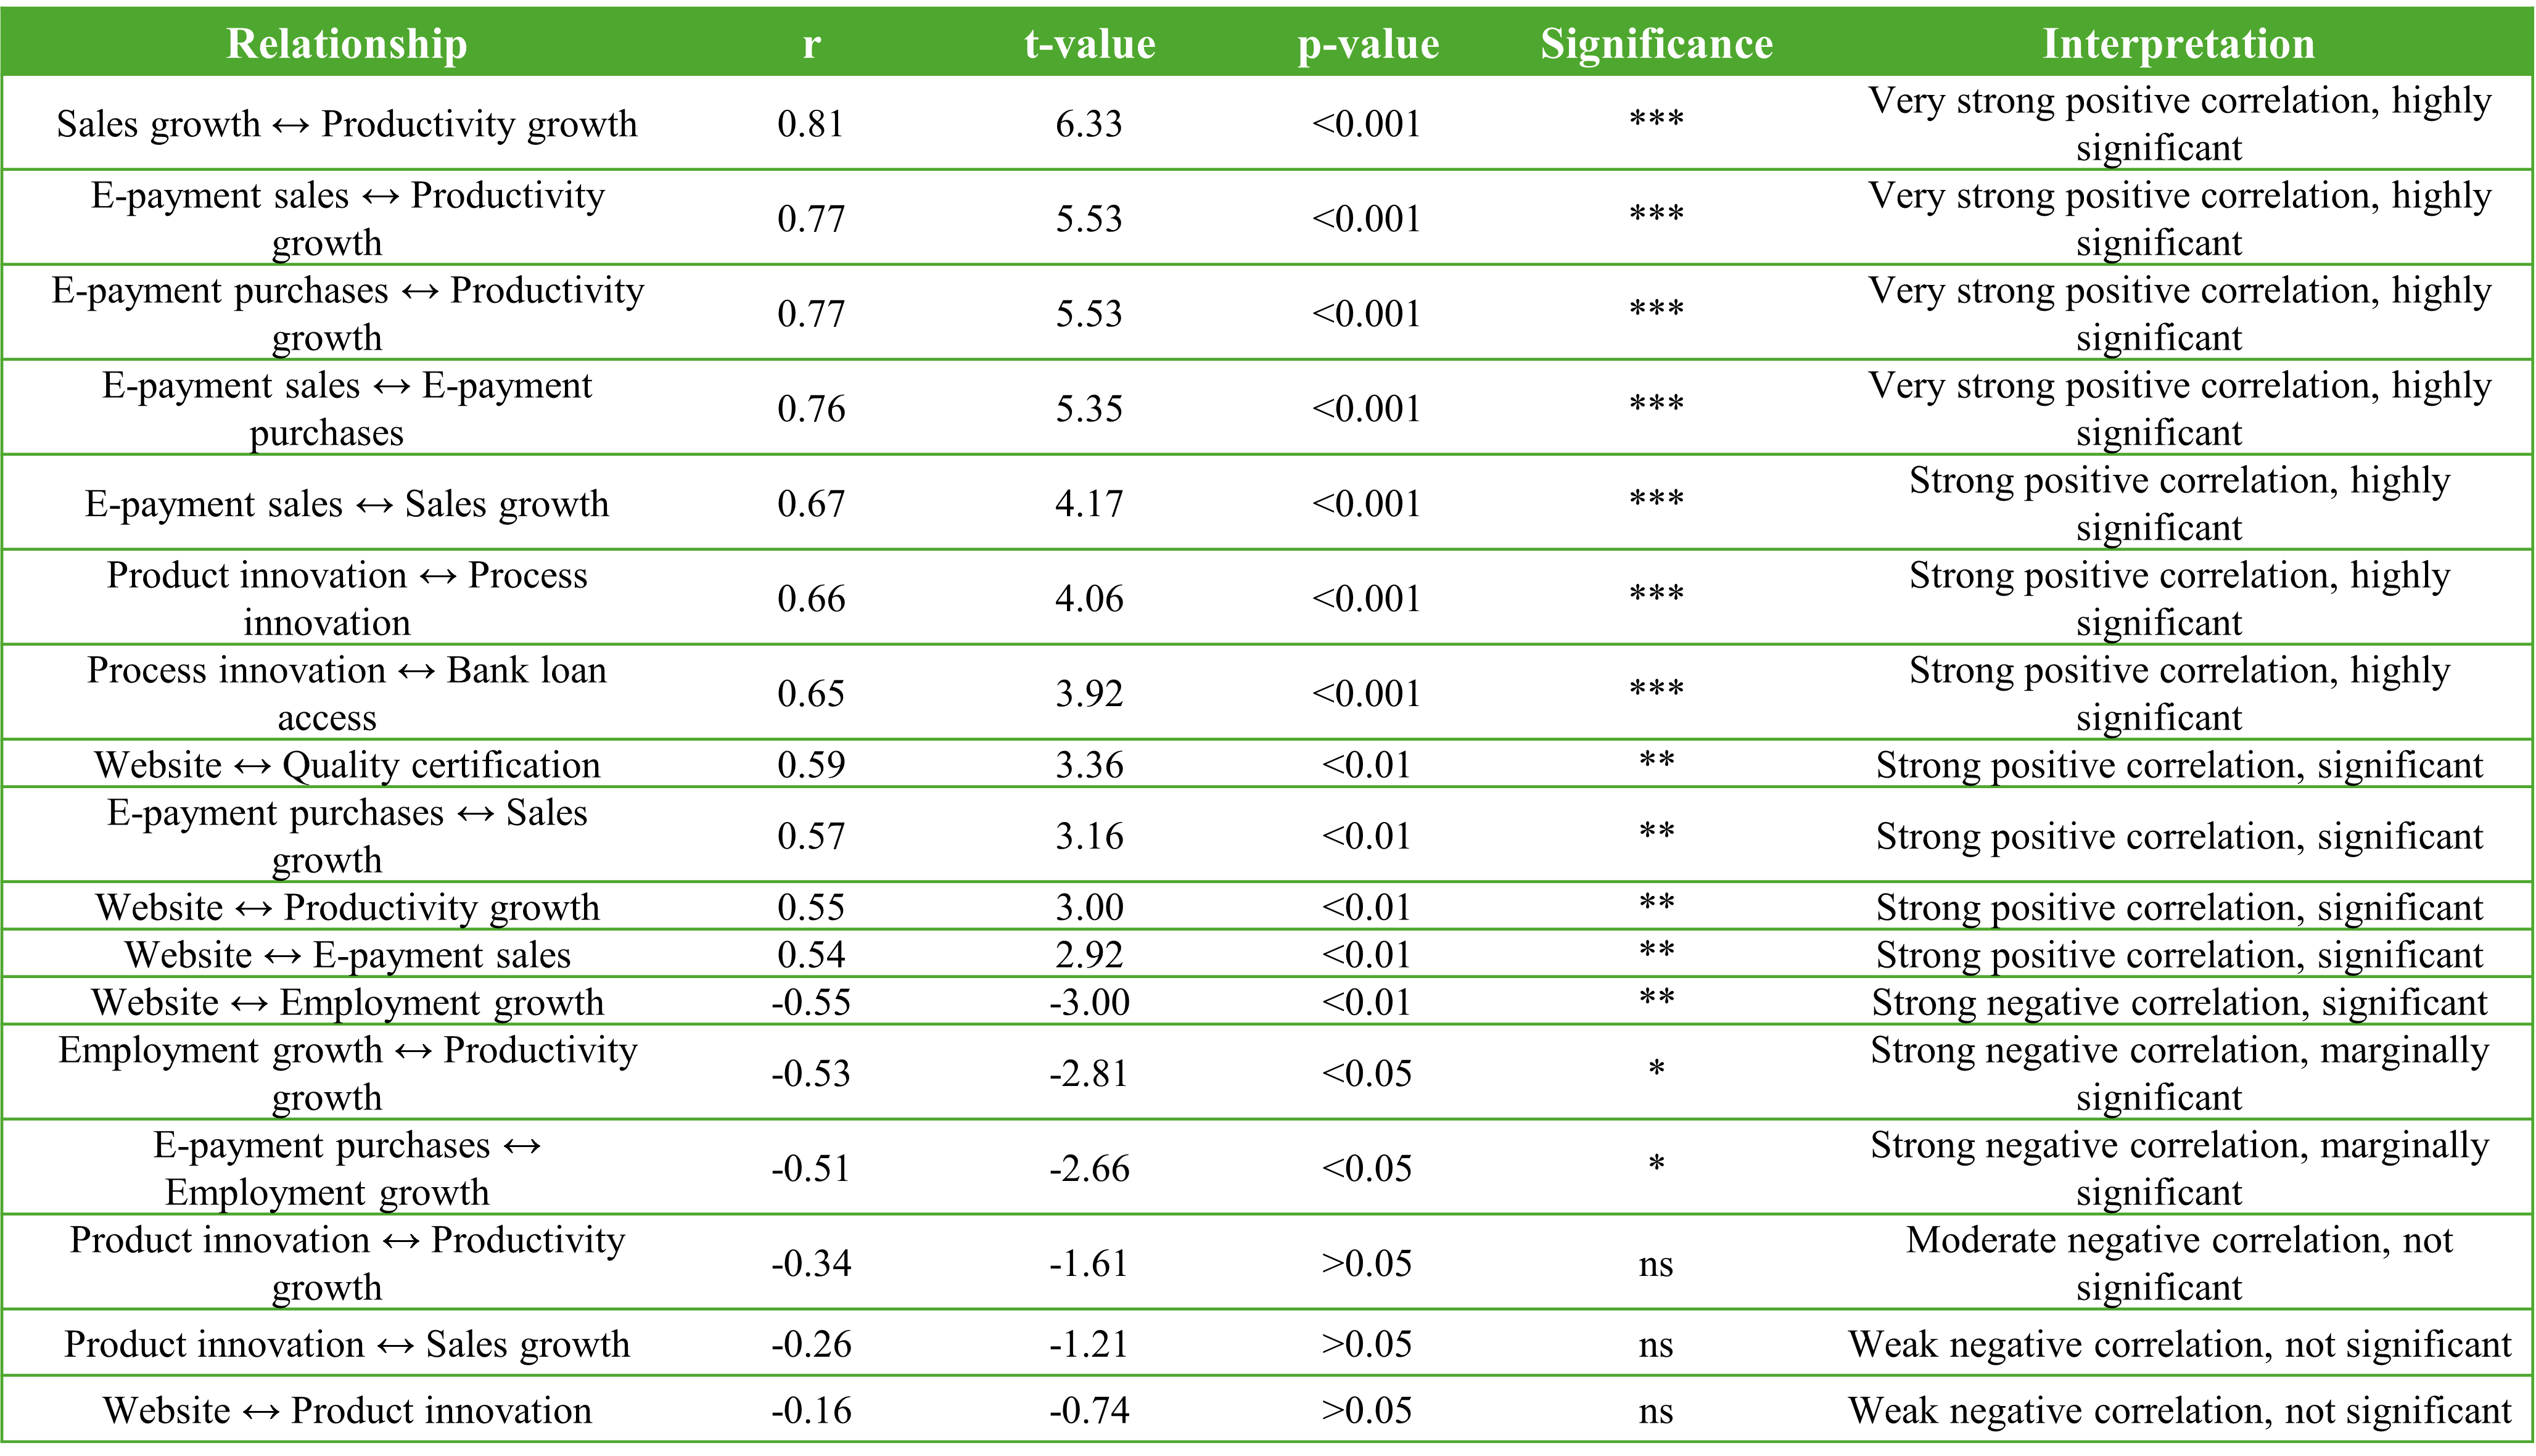
Source: Authors' calculations.
Note: *** p < 0.001 (highly significant), ** p < 0.01 (significant), * p < 0.05 (marginally significant), ns = not significant. Critical value: |t| > 2.08. Based on 23 enterprise segments with 21 degrees of freedom. Correlation strength categories: Very strong (|r| > 0.70), Strong (0.50 < |r| ≤ 0.70), Moderate (0.30 < |r| ≤ 0.50), Weak (|r| ≤ 0.30).
 DIGITAL TECHNOLOGY ADOPTION AND INNOVATION PERFORMANCE IN VIETNAMESE ENTERPRISES: EVIDENCE FROM THE 2023
ENTERPRISE SURVEY
DIGITAL TECHNOLOGY ADOPTION AND INNOVATION PERFORMANCE IN VIETNAMESE ENTERPRISES: EVIDENCE FROM THE 2023
ENTERPRISE SURVEY